

Plastic pollution is now found across marine environments, from coastlines and coral reefs to the open ocean and deep sea. For divers, its effects can be particularly visible: plastic bags caught on reefs, fishing lines wrapped around corals, abandoned nets on wrecks, and fragments of plastic scattered across the seabed.
But understanding where ocean plastic comes from is more complicated than many viral graphics suggest.
Country rankings frequently presented as lists of the world’s biggest “ocean polluters” often measure only one pathway by which plastic reaches the sea. Some measure plastic carried by rivers. Others estimate plastic entering the ocean from land based coastal populations.
Neither represents every source of plastic pollution in the ocean.
The distinction is important.
What Is Riverine Plastic Pollution?
Riverine plastic is plastic waste transported through rivers and eventually discharged into the ocean.
Plastic discarded or poorly managed on land can be carried by rain, drains, streams and waterways into river systems. Whether that waste ultimately reaches the sea depends on many factors, including distance from the coast, rainfall, geography, river flow and the ability of waste management systems to prevent plastic from entering the environment.
One of the most detailed global studies of this pathway was published in Science Advances in 2021 by Lourens Meijer and colleagues.
The study, More than 1000 rivers account for 80% of global riverine plastic emissions into the ocean, used a global model incorporating waste generation, geography, hydrology and plastic transport probabilities.
Rather than finding that only a handful of very large rivers dominate global emissions, the researchers estimated that 1,656 rivers account for approximately 80 percent of riverine plastic emissions to the ocean.
The researchers also concluded that smaller urban rivers can play a substantial role because they are often located close to densely populated areas and the coast.
Which Countries Have the Highest Estimated Riverine Plastic Emissions?
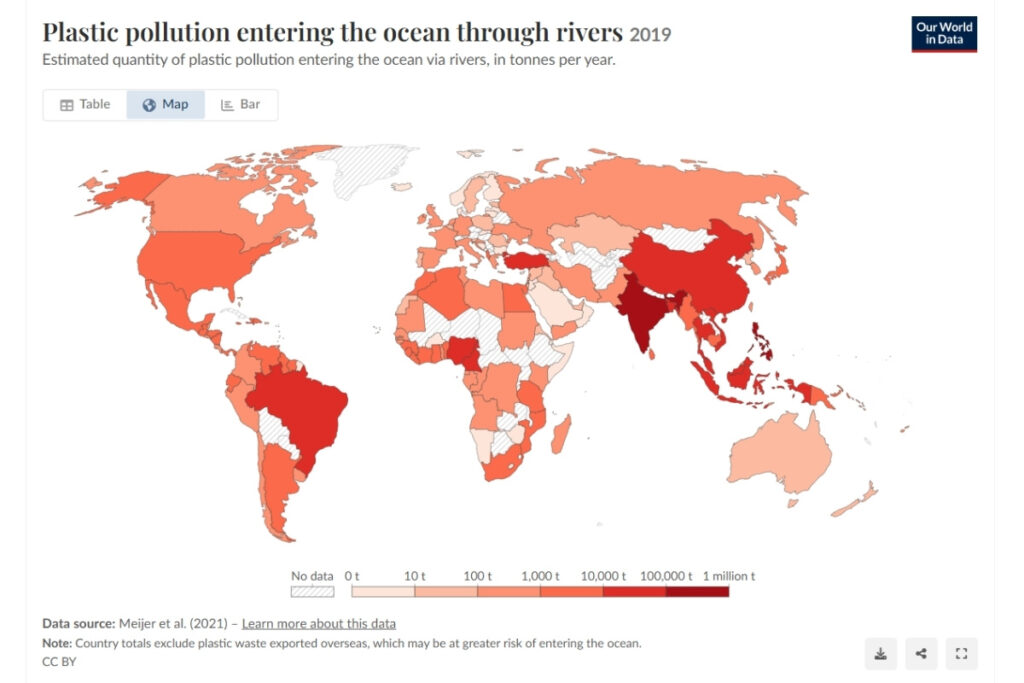
The country statistics from the Meijer study are available through Our World in Data’s Plastic Pollution dataset.
Our World in Data currently presents these country level figures as 2019 data and describes them specifically as the estimated quantity of plastic pollution entering the ocean through rivers.
Top 10 Countries by Estimated Riverine Plastic Entering the Ocean
| Rank | Country | Estimated tonnes per year |
|---|---|---|
| 1 | Philippines | 356,371 |
| 2 | India | 126,513 |
| 3 | Malaysia | 73,098 |
| 4 | China | 70,707 |
| 5 | Indonesia | 56,333 |
| 6 | Myanmar | 40,000 |
| 7 | Brazil | 37,799 |
| 8 | Vietnam | 28,221 |
| 9 | Bangladesh | 24,640 |
| 10 | Thailand | 22,806 |
Source: Meijer et al. 2021, Science Advances, with country data presented by Our World in Data
The Philippines stands far above the other countries in this particular model, with an estimated 356,371 tonnes per year entering the ocean through rivers. India follows at 126,513 tonnes, while Malaysia and China are estimated at just over 70,000 tonnes each.
These figures should not, however, be described as measurements of total ocean pollution produced by each country.
The Figures Are Estimates, Not Direct Measurements
The river figures come from a statistical model.
Our World in Data explains that the calculations combine local quantities of mismanaged plastic waste with the probability that the waste will reach the ocean. Environmental conditions, geographical location and the characteristics of individual river systems all influence that probability.
The dataset mainly represents larger floating plastic items, typically above about 0.5 centimetres. It does not fully account for very small microplastics, plastic resting on riverbeds or plastic trapped behind dams.
The estimates also carry considerable uncertainty. Our World in Data cautions that actual river emissions can differ substantially from modelled values.
This is why a headline such as “Countries Responsible for the Most Ocean Pollution” would be scientifically misleading when attached to this dataset.
A more accurate description is:
Countries with the highest estimated riverine plastic emissions to the ocean.
Riverine Plastic Is Not the Same as All Ocean Plastic
Rivers are an important pathway, but ocean plastic can reach marine environments through several routes.
According to the NOAA Marine Debris Program, marine debris can originate from activities on land or directly at sea.
Land based debris can reach waterways through littering, storm drains, flooding and inadequate waste management.
Ocean based debris can include lost fishing equipment, aquaculture materials, waste from vessels and debris associated with offshore activities. NOAA specifically identifies fishing gear, aquaculture debris and material lost from vessels among sources generated at sea. (NOAA Ocean Based Marine Debris)
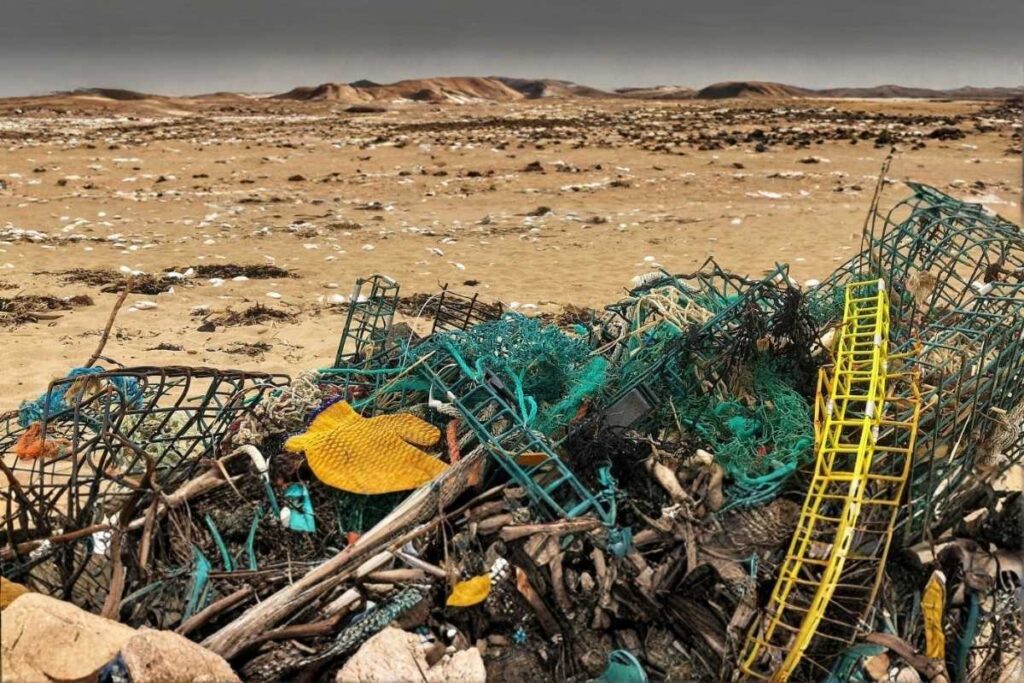
That means a plastic fishing net lost directly from a vessel may never pass through a river.
It would therefore not appear in a ranking based solely on river emissions.
Is There a Ranking for Total Ocean Plastic Pollution by Country?
There is no widely accepted current global ranking that measures every form of ocean plastic pollution and assigns the total to individual countries.
Producing such a ranking would require accounting for river emissions, direct coastal leakage, fishing gear, shipping, aquaculture, offshore activities, microplastics and the international movement of plastic waste.
Researchers have, however, attempted to estimate broader land based plastic inputs to the ocean.
One of the most influential studies was published in Science in 2015 by Jenna Jambeck and colleagues.
The study, Plastic waste inputs from land into the ocean, examined waste generated in 192 coastal countries and estimated how much plastic waste from populations living within 50 kilometres of the coastline could enter the ocean.
The study estimated that 4.8 million to 12.7 million tonnes of plastic waste entered the ocean from land in 2010.
Its country ranking was very different from the later riverine model.
Historical Ranking of Estimated Land Based Plastic Inputs to the Ocean
Jambeck et al. estimates based on 2010 data
| Rank | Country | Estimated million tonnes per year |
|---|---|---|
| 1 | China | 1.32 to 3.53 |
| 2 | Indonesia | 0.48 to 1.29 |
| 3 | Philippines | 0.28 to 0.75 |
| 4 | Vietnam | 0.28 to 0.73 |
| 5 | Sri Lanka | 0.24 to 0.64 |
| 6 | Thailand | 0.15 to 0.41 |
| 7 | Egypt | 0.15 to 0.39 |
| 8 | Malaysia | 0.14 to 0.37 |
| 9 | Nigeria | 0.13 to 0.34 |
| 10 | Bangladesh | 0.12 to 0.31 |
Source: Jambeck et al. 2015, Plastic waste inputs from land into the ocean, Science
The original study’s Table 1 ranked China first, followed by Indonesia, the Philippines and Vietnam.
However, this table requires an important warning.
It is not a current ranking, and at least one of its country estimates has subsequently been questioned.
A Data Problem With the Historical Sri Lanka Estimate
Later research identified a likely problem with the waste data used for Sri Lanka in the Jambeck model.
A 2022 peer reviewed analysis of plastic sources in the Indian Ocean reported that the original estimate relied on a municipal waste generation figure of 5.1 kilograms per person per day for Sri Lanka.
Updated World Bank information put the figure much lower.
The researchers recalculated Sri Lanka’s estimated coastal plastic input at approximately 0.021 million to 0.057 million tonnes, instead of the original range of 0.24 million to 0.64 million tonnes.
The analysis is available in the journal Ocean Science: Plastics in the Indian Ocean: sources, transport, distribution and impacts.
For this reason, the Jambeck table should be treated as the published historical output of the 2015 study, rather than a definitive current ranking of countries responsible for ocean plastic pollution.
This illustrates another problem with simple country league tables. Estimates can change as waste statistics, monitoring methods and environmental models improve.
Why the Two Rankings Are So Different
The riverine and land based rankings answer different questions.
The Meijer model asks:
How much plastic is estimated to reach the ocean through rivers?
The Jambeck model asks:
How much mismanaged plastic waste generated by coastal populations could enter the ocean from land?
The methodology, geographical boundaries, data sources and reference periods are different.
This explains why the Philippines ranks first in the riverine dataset while China ranked first in the older coastal land based estimate.
It does not necessarily mean that one study is correct and the other is wrong. They are measuring different pathways.
It also demonstrates why statements such as “Country X is the world’s biggest ocean plastic polluter” should be treated cautiously unless the methodology is clearly explained.
How Much Plastic Enters the Ocean Globally?
Even the global figure depends heavily on what researchers are measuring.
The OECD Global Plastics Outlook estimated that 6.1 million tonnes of plastic waste leaked into rivers, lakes and the ocean in 2019.
The OECD estimated that 1.7 million tonnes flowed into the oceans during 2019. It also estimated that around 30 million tonnes had accumulated in seas and oceans by that point, while approximately 109 million tonnes had accumulated in rivers.
That river accumulation is important.
Plastic entering a river does not necessarily arrive in the sea immediately. Some material can remain in river systems for years or longer before being transported farther downstream.
This creates a continuing reservoir of plastic pollution even if new leakage is reduced.
Why Other Global Estimates Can Be Much Higher
The United Nations Environment Programme currently states that approximately 19 million to 23 million tonnes of plastic waste leak into aquatic ecosystems each year.
But aquatic ecosystems include rivers, lakes and seas, not just the ocean.
The figure is published by UNEP’s Plastic Pollution and Marine Litter programme.
UNEP has also estimated that between 75 million and 199 million tonnes of plastic are already present in the ocean.
These figures should not be compared directly with the Meijer river estimates or the OECD ocean inflow estimate as if they were measuring exactly the same thing.
Different assessments use different boundaries, definitions, particle sizes and modelling approaches.
A figure describing plastic entering all aquatic ecosystems is not equivalent to a figure describing plastic reaching the ocean during a particular year.
What Happens to Plastic Once It Reaches the Ocean?
Plastic does not simply disappear once it enters marine waters.
Some material washes onto beaches. Some remains near coastlines. Some is transported by currents. Some sinks or becomes incorporated into sediments. Larger pieces can also gradually fragment into increasingly small particles.
The US Environmental Protection Agency states that plastic pollution can persist in the environment for very long periods and can fragment into microplastics and nanoplastics.
Marine animals can become entangled in plastic or ingest it.
The EPA reports that plastic pollution increases the risk of ingestion, suffocation and entanglement for marine species.
For divers, these impacts may be encountered directly on coral reefs, wrecks, rocky habitats and coastal dive sites.
Microplastics Add Another Dimension
Large visible debris represents only part of the plastic problem.
Microplastics are generally defined as plastic particles smaller than 5 millimetres.
They can form when larger plastic objects fragment, but they can also enter the environment directly from sources including synthetic textiles, vehicle tyre wear and industrial plastic pellets.
The OECD Global Plastics Outlook estimated that microplastics accounted for approximately 12 percent of global plastic leakage to the environment in 2019, with sources including tyre abrasion, brake wear and textile washing.
These particles are particularly difficult to recover once dispersed through aquatic environments.
Research has also detected microplastics in human tissues, although the full consequences for human health remain under investigation. The EPA states that further research is needed to understand the potential health effects. (EPA Plastic Pollution Impacts)
Fishing Gear Is Part of the Ocean Plastic Story
Divers regularly encounter another category of marine debris that cannot be understood through river statistics alone: abandoned or lost fishing gear.
The NOAA Marine Debris Program defines derelict fishing gear as lost or discarded lines, nets, pots, traps, floats and other equipment.
Such material can continue to pose hazards after it is lost.
It can become caught on reefs and wrecks and can entangle marine wildlife.
Because much of this material originates from activities at sea, it illustrates why river based statistics provide only one part of the ocean plastic picture.
Plastic Is the Dominant Component of Marine Litter
The scale of the problem extends well beyond individual bottles, bags or fishing lines.
The United Nations Environment Programme’s global assessment of marine litter and plastic pollution reported that plastics account for at least 85 percent of marine waste.
This persistence means plastic can accumulate across marine habitats and continue affecting ecosystems long after it first enters the water.
Country Rankings Need Context
Country rankings can be useful when they identify where particular pollution pathways are concentrated.
But they become misleading when the title claims more than the underlying data measures.
The Philippines ranking first for estimated riverine plastic emissions does not establish that the Philippines is responsible for more total ocean plastic pollution than every other country.
Similarly, China’s number one position in the Jambeck study does not establish that China remains the world’s largest source of marine plastic today.
One dataset describes river transport.
The other describes estimated land based inputs from coastal populations using 2010 data.
Neither comprehensively measures plastic from fishing, shipping, aquaculture, microplastic sources and every other pathway into the marine environment.
The Responsibility Is Also International
Plastic pollution cannot be understood only by looking at the country where waste finally enters the water.
Plastic products can be manufactured in one country, consumed in another, exported as waste, processed elsewhere and eventually leak into the environment somewhere else.
The OECD emphasizes that global plastic value chains and international trade need to be considered when developing solutions to plastic pollution. (OECD Global Plastics Outlook)
At the same time, inadequate collection and disposal remain major drivers of macroplastic leakage.
This makes both local waste infrastructure and international action important.
Preventing Plastic Before It Reaches the Sea
Once plastic becomes dispersed through the ocean, recovering it becomes considerably more difficult.
Preventing leakage therefore remains critical.
Better waste collection, effective disposal systems, improved recycling, reduction of unnecessary plastic use and preventing litter from reaching waterways can reduce land based inputs.
River interception can address another part of the problem.
Measures targeting fishing and maritime activities can reduce lost fishing gear and other ocean based debris.
No single intervention addresses every source.
One Ocean Plastic Problem, Many Pathways
Riverine plastic pollution and ocean plastic pollution are closely connected, but they are not interchangeable terms.
Rivers transport significant quantities of plastic from land toward the sea and represent an important opportunity for intervention.
But plastic also enters marine environments directly from coastlines, fishing, shipping, aquaculture and other activities.
That is why the numbers need context.
The riverine ranking based on the Meijer study identifies countries where the model estimates especially high plastic transport through rivers.
The Jambeck ranking provides an older estimate of land based plastic inputs from coastal populations.
Neither should be labelled as a definitive list of the countries “responsible for the most ocean pollution.”
The scientific picture is more complicated.
Understanding those differences does not make the plastic problem less serious. It makes the information used to describe it more accurate, and better information is essential for identifying where action can have the greatest impact.

Mohsen Nabil is the Founder and Editor-in-Chief of Diventures Magazine. A mechanical engineer and scuba diving instructor based in the Red Sea, he writes about diving safety, marine conservation, underwater exploration, and developments in the global dive industry. Through Diventures Magazine, he works to connect divers, scientists, and ocean advocates while promoting responsible diving and protection of the oceans.